
Periodic power, apparent power, voltage, frequency, and phase conditions provide operating context for dispatch and capacity review.
Connected generation intelligence
Perkins Generator smart power makes operating conditions visible
Connect generator controllers, transfer equipment, fuel status, alarms, and maintenance records in one operating view. The dashboard structure below turns field signals into prioritized decisions without claiming that remote monitoring replaces on-site inspection.
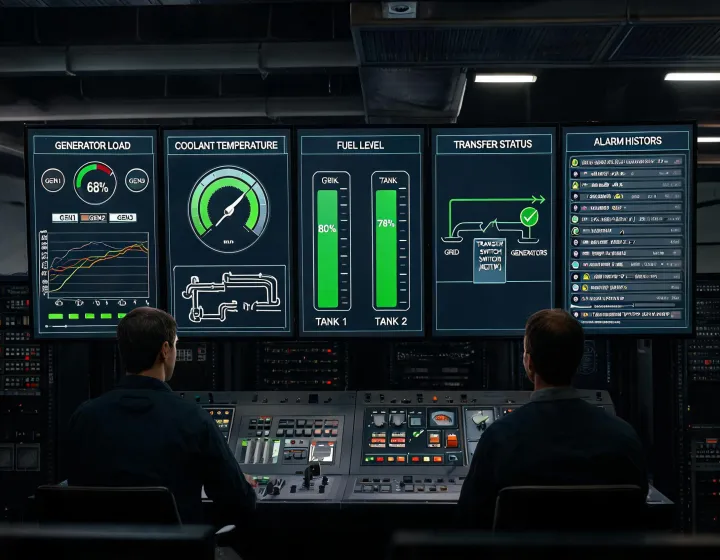
Operating dashboard
Four signal groups, one actionable view
Each signal group combines a defined data source, sampling interval, alarm threshold, and response owner. Connectivity improves visibility, while local protective controls remain responsible for safe generator operation.
Coolant temperature, oil pressure, battery voltage, speed, and runtime trends help teams identify changes before a planned service window.
Fuel level, estimated runtime, duty profile, and refill events are reviewed together; estimates still depend on actual loading and calibrated sensors.
Start commands, transfer position, breaker state, shutdown alarms, and acknowledgement history create a traceable sequence for troubleshooting.
Engineering records behind useful monitoring
Signal and protocol registerConfigured
Maps controller points, units, normal ranges, alarm thresholds, polling intervals, and Modbus TCP or gateway addresses.
Alarm response matrixSite-defined
Assigns severity, acknowledgement rules, escalation contacts, and field checks for each actionable event.
Fuel and runtime clarification logPeriodic
Records load, voltage, frequency, coolant temperature, oil pressure, battery condition, and fuel behavior under comparable duty windows.
Transfer and alarms and readiness checklistCommissioning
Confirms time synchronization, point scaling, lost-communications behavior, alarm routing, user access, and retention settings.
Validation gates for connected power
Signals defined at the source
Technicians verify controller firmware, available points, transducer ranges, transfer interfaces, and network boundaries before integration.
Data path tested
Teams confirm protocol mapping, timestamps, sampling behavior, offline buffering, and read-only boundaries in a controlled commissioning session.
Alarm logic challenged
A documented test injects representative warning, shutdown, transfer, and communications-loss states, then records receipt and escalation.
Trends enter maintenance review
Operations teams review trend windows against actual duty and service findings; sensor drift, network loss, and incomplete context remain explicit limitations.
Map your connected power signals
Share the controller model, one-line diagram, network policy, desired points, alarm recipients, and maintenance workflow for an integration review.